Welcome to Hua Sheng Blog! This is a data analysis case 0001. original source: kaggle. Most of the content in this article comes from it, Good Luck!

数据预处理 & 特征工程

数据预处理

1
2
3
4
5
6
7
8
9
10
11
12
13
14
15
import pandas as pd
import numpy as np
import matplotlib.pyplot as plt
import seaborn as sns
from sklearn.experimental import enable_iterative_imputer
from sklearn.impute import (SimpleImputer, IterativeImputer)
from sklearn.preprocessing import (OneHotEncoder, StandardScaler)
from sklearn.model_selection import (GridSearchCV, cross_val_score)
from sklearn.cluster import KMeans
from catboost import CatBoostClassifier

from sklearn.ensemble import RandomForestRegressor
full_df = pd.read_csv('../数据源/titanic/train.csv')
test_df = pd.read_csv("../数据源/titanic/test.csv")
full_df.head()

数据预览

1
2
3
4
5
6
7
8
9
10
11
12
13
14
15
# Separate test_df PassengerId (will need it for submission)
test_pass_id = test_df.pop('PassengerId')

# Keep max index that will be used to back split training and test data
X_max_index = full_df.shape[0]

# Separate features and target
y = full_df.Survived

df = full_df.drop(['Survived', 'PassengerId'], axis=1)
df = pd.concat([df, test_df], axis=0).reset_index(drop=True)

full_df.corr()["Survived"].sort_values()

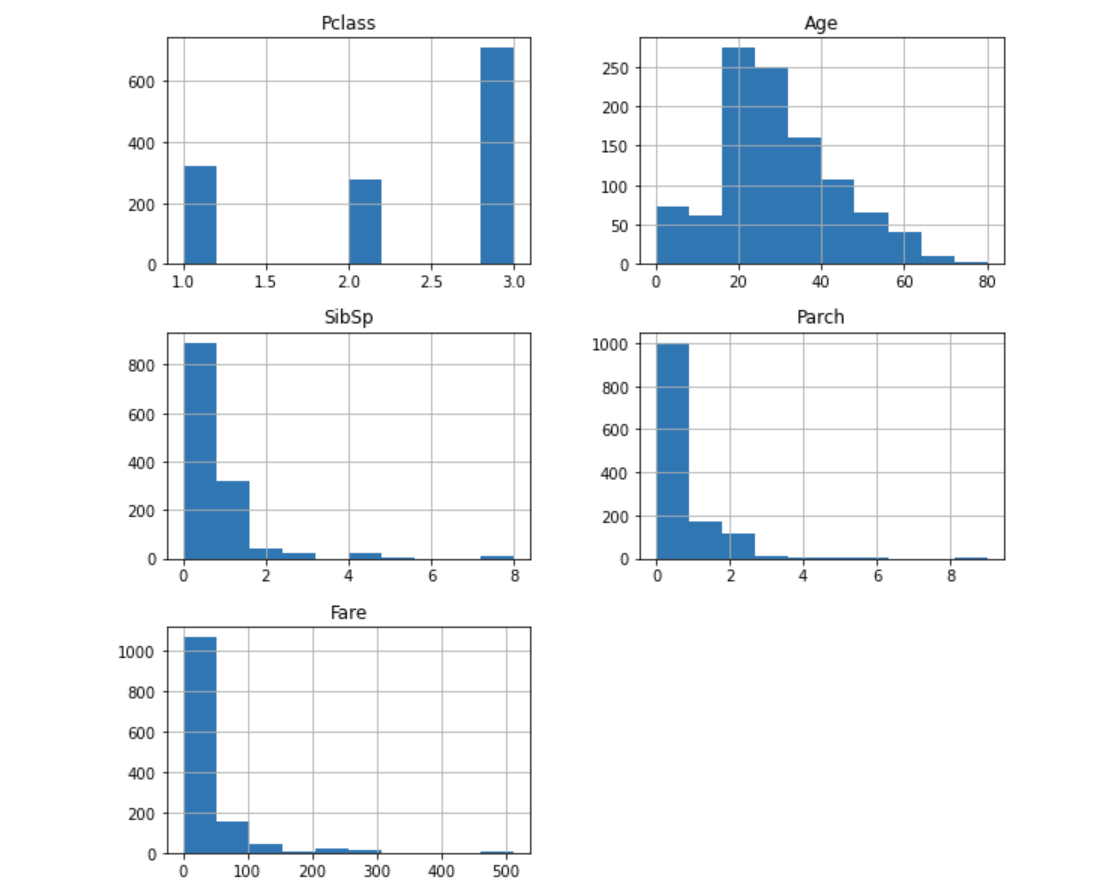
df.hist(figsize=(10,10))

数据分布

1
2
3
4
5
6
7
8
9
10
11
12
13
14
15
16
17
18
19
20
21
22
23
24
25
26
27
28
29
30
31
32
33
34
35
36
37
38
39
40
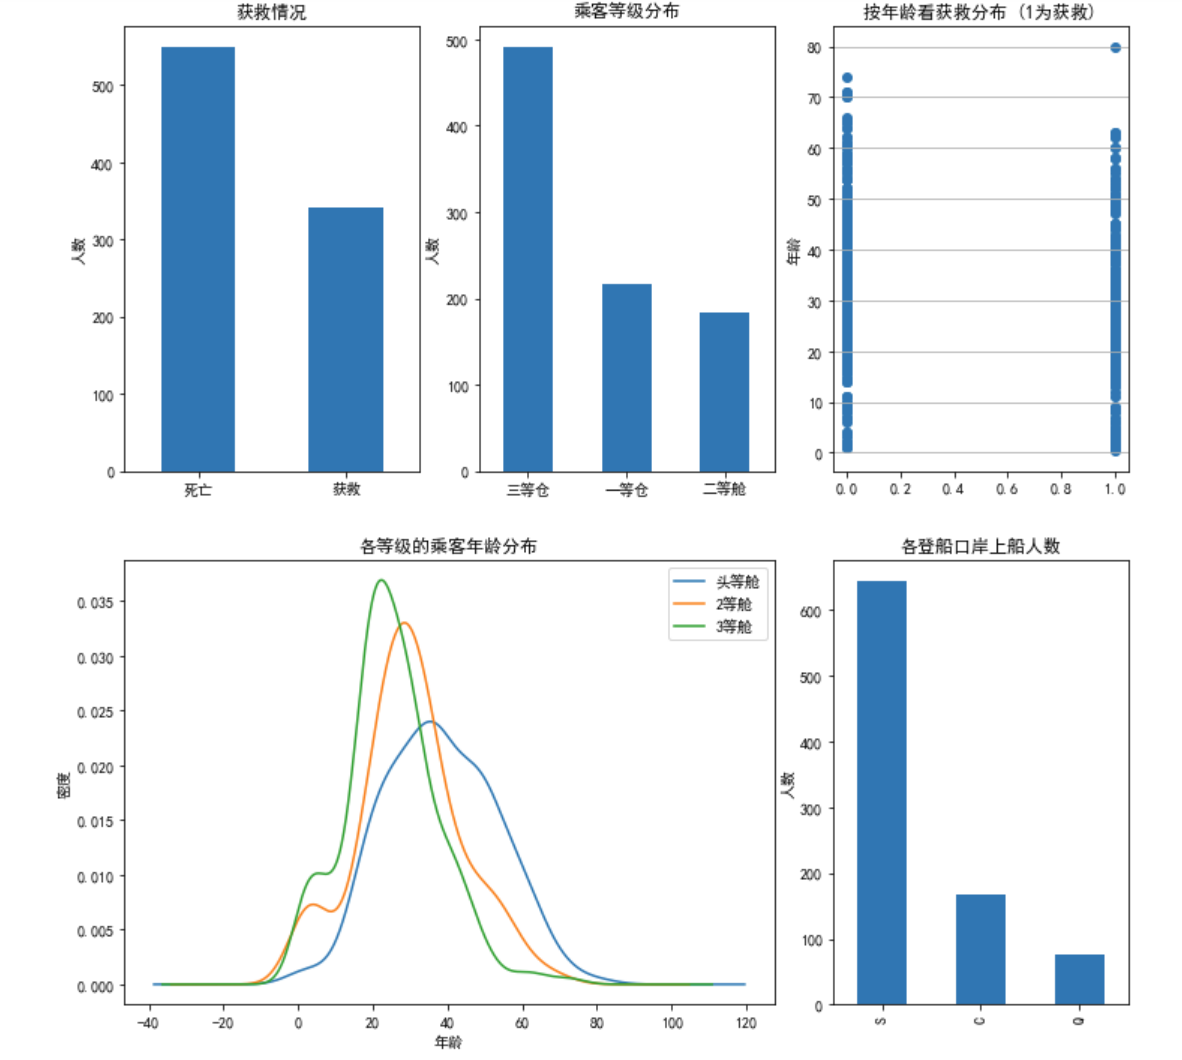
plt.rcParams['font.sans-serif'] = ['SimHei']
plt.rcParams["axes.unicode_minus"] = False
fig = plt.figure(figsize=(18,18))
fig.set(alpha=0.2) # 设定图表颜色alpha参数


plt.subplot2grid((2,3),(0,0)) # 在一张大图里分列几个小图
full_df.Survived.value_counts().plot(kind='bar')# 柱状图
plt.title(u"获救情况") # 标题
plt.ylabel(u"人数")
plt.xticks(np.arange(2), ['死亡','获救'],rotation=0)

plt.subplot2grid((2,3),(0,1))
full_df.Pclass.value_counts().plot(kind="bar")
plt.ylabel(u"人数")
plt.title(u"乘客等级分布")
plt.xticks(np.arange(3), ['三等仓','一等仓','二等舱'],rotation=0)

plt.subplot2grid((2,3),(0,2))
plt.scatter(full_df.Survived, full_df.Age)
plt.ylabel(u"年龄") # 设定纵坐标名称
plt.grid(b=True, which='major', axis='y')
plt.title(u"按年龄看获救分布 (1为获救)")


plt.subplot2grid((2,3),(1,0), colspan=2)
full_df.Age[full_df.Pclass == 1].plot(kind='kde')
full_df.Age[full_df.Pclass == 2].plot(kind='kde')
full_df.Age[full_df.Pclass == 3].plot(kind='kde')
plt.xlabel(u"年龄")# plots an axis lable
plt.ylabel(u"密度")
plt.title(u"各等级的乘客年龄分布")
plt.legend((u'头等舱', u'2等舱',u'3等舱'),loc='best') # sets our legend for our graph.


plt.subplot2grid((2,3),(1,2))
full_df.Embarked.value_counts().plot(kind='bar')
plt.title(u"各登船口岸上船人数")
plt.ylabel(u"人数")
plt.show()

数据相关性

1
2
3
4
5
6
7
8
9
10
11
12
13
14
15
16
17
18
19
20
21
22
23
24
25
26
27
28
29
30
31
32
33
34
35
36
37
38
39
40
41
42
43
44
45
46
47
48
49
50
51
52
53
54
55
56
57
58
59
60
61
62
63
64
65
66
67
68
69
70
71
72
73
74
75
76
77
78
79
80
81
82
83
84
85
86
87
88
89
90
91
92
93
94
95
96
97
98
99
100
101
102
103
104
105
106
107
108
109
110
111
112
113
114
115
116
117
118
119
120
121
122
123
124
125
126
127
128
129
130
131
132
133
134
135
136
137
138
139
140
141
142
143
144
145
146
147
148
149
150
151
152
153
154
155
156
157
158
159
160
161
162
163
164
165
166
167
168
169
170
171
172
173
174
175
176
177
178
179
df['Lastname'] = df.Name.str.split(', ').str[0]

# Extracting the Title from Name column
df['Title'] = df.Name.str.split(', ').str[1]
df['Title'] = df.Title.str.split('.').str[0]

df.Title.value_counts()

# Grouping the same type titles

# We change also Miss to Mrs, but later we will convert back
# to Miss just for underage females as for now Miss is not
# very usefull as it represents a young lady and also
# an unmarried adult one of any age


females = ['Ms', 'Miss', 'Mlle', 'Mrs', 'Mme']
df.loc[df.Title.isin(females), 'Title'] = 'Mrs'

males = ['Master', 'Mr']
df.loc[(df.Title.isin(males)), 'Title'] = 'Mr'

# Change the titles for underage persons to Master and Miss
df.loc[((df.Title == 'Mr') & (df.Age < 18)), 'Title'] = 'Master'
df.loc[((df.Title == 'Mrs') & (df.Age < 18)), 'Title'] = 'Miss'

# Create noble title
df.loc[(~df.Title.isin(females) & ~df.Title.isin(males)), 'Title'] = 'Noble'

# Split Ticket by series and number
df['Ticket_series'] = [i[0] if len(i) > 1 else 0 for i in df.Ticket.str.split()]
df['Ticket_nr'] = [i[-1] for i in df.Ticket.str.split()]

# Create a column with the passengers number by ticket
ticket_dict = df.groupby('Ticket_nr').Lastname.count().to_dict()

df['Passengers_ticket'] = df.Ticket_nr.map(ticket_dict)

# Create Price column
df['Price'] = (df.Fare / df.Passengers_ticket).round()

# Function for imputing Deck
def impute_deck_by(feature):
for pclass in range(1, 4):
# Create a mapping dictionary
map_dic = (df[~df.Deck.isna()
& (df.Pclass == pclass)]
.groupby(feature)
.Deck.unique()
.apply(list).to_dict())

# Keep just the keys with a single deck to avoid
# the same key on different decks
map_dic = {i:j[0] for i, j in map_dic.items()
if len(j) == 1}

# Imputing Deck from map_dic
df.loc[df.Deck.isna() & (df.Pclass == pclass),
'Deck'] = df[feature].map(map_dic)

# Check how many missing values we have at this step
print(df.Deck.isna().sum())

# Analyze Price by Deck and Pclass
df.groupby(['Pclass', 'Deck']).Price.describe()

df.loc[df.Deck == 'T', 'Deck'] = 'A'

df[df.Deck == 'B'].sort_values('Price').head()

for i in [1,2,3]:
for j in df[(df["Fare"]==0) & (df["Pclass"] == i)]["Price"].index:
df.loc[j,"Price"] = df[(df["Fare"]!=0) & (df["Pclass"] == i) ]["Price"].mean()

df.loc[(df.Ticket_nr == '695'), 'Price'] = 19

class_deck_price = pd.DataFrame(df.groupby(['Pclass', 'Deck'])
.Price.mean().round(2)).reset_index()

# Impute missing prices
# Where Deck is missing we will use the mean price by Pclass only
for index, row in df.loc[df.Price.isna(),
['Pclass', 'Deck']].iterrows():
if not pd.isna(row.Deck):
new_price = class_deck_price.loc[
((class_deck_price.Pclass == row.Pclass)
& (class_deck_price.Deck == row.Deck)), 'Price'].mean()
else:
new_price = class_deck_price[
class_deck_price.Pclass == row.Pclass].Price.mean()

df.loc[[index], 'Price'] = new_price

# Create dictionaries with aproximative price ranges by deck
# concluded from previous analisys
first_cl = {'A': [25, 30],
'B': [35, 70],
'C': [30, 35],
'D': [19, 25],
'E': [9, 19]}

second_cl = {'D': [13, 17],
'E': [5, 9],
'F': [9, 13]}

third_cl = {'E': [8, 9],
'F': [9, 21],
'G': [0, 8]}

# Create a dictionary pairing Pclass and respective price dictionary
class_dict = {1: first_cl,
2: second_cl,
3: third_cl}

# Impute missing Deck values
for index, row in df.loc[df.Deck.isna(), ['Pclass', 'Price']].iterrows():
for c, d in class_dict.items():
if row.Pclass == c:
for i, j in d.items():
if max(j) > row.Price >= min(j):
df.loc[[index], 'Deck'] = i

# Encode Deck with it's deck level number counting from the bottom
deck_level = {'G': 1, 'F': 2, 'E': 3, 'D': 4, 'C': 5, 'B': 6, 'A': 7}

df.Deck = df.Deck.replace(deck_level)

# Analyse how many people were on each deck.
# Many values were imputed with aproximation,but at least we will have
# an aproximative crowd mass each passenger has to pass going up
deck_people = df.Deck.value_counts().sort_index().to_dict()

# Create an escape density dictionary from which we will impute data to our new feature
escape_density = {}
for i in range(1, 8):
escape_density[i] = sum(deck_people.values())
del deck_people[i]

# Create Escape_density column
df['Escape_density'] = df.Deck.replace(escape_density)

# We add together the person and his SibSp and Parch
df['Family_size'] = 1 + df.SibSp + df.Parch

# Create full data frame for analysis
X = df[:X_max_index]
test_df = df[X_max_index:].copy()
full_df = pd.concat([X, y], axis=1).copy()

# Check for families that has survivers and create a dictionary with mean value of their family survivability
family_survivers = full_df[['Lastname', 'Survived']].groupby('Lastname').mean().round(2).reset_index()
family_survivers_dict = dict(zip(family_survivers.Lastname, family_survivers.Survived))

# Reduce the dictionary to the list of families that are both in train and test data
common_survivers = {}
for lastname, survived in family_survivers_dict.items():
if lastname in list(test_df['Lastname'].unique()):
common_survivers[lastname] = survived

# Create Family_survivers feature
test_df['Family_survivers'] = test_df.Lastname.map(common_survivers)
full_df['Family_survivers'] = full_df.Lastname.map(common_survivers)

# For the families that are not present in both train and test we will impute the overall mean value
test_df.Family_survivers = test_df.Family_survivers.fillna(test_df.Family_survivers.mean())
full_df.Family_survivers = full_df.Family_survivers.fillna(full_df.Family_survivers.mean())

# Separate back features and target
y = full_df.Survived

df = full_df.drop('Survived', axis=1)
df = pd.concat([df, test_df], axis=0).reset_index(drop=True)

# Change Pclass dtype to category as it's a classification feature
df.Pclass = df.Pclass.astype('category')

col_drop = ['Name', 'Ticket', 'Fare', 'Cabin', 'Lastname','Ticket_nr',
'Ticket_series', 'Passengers_ticket']
df = df.drop(col_drop, axis=1)

建模前的数据展示

模型构建前分析

1
2
3
4
5
6
7
8
9
10
11
12
13
14
15
16
17
18
19
20
21
22
23
24
25
26
27
28
29
30
31
32
33
34
35
36
37
38
39
40
41
42
43
44
45
46
47
48
49
50
51
52
53
54
55
56
57
58
59
60
61
62
63
64
65
66
67
68
69
70
71
72
73
74
75
76
77
78
79
80
81
82
83
84
85
86
87
88
89
90
91
92
93
# List of categorical columns
categ_cols = list(df.select_dtypes(['object', 'category']).columns)

# Impute categoricals with most frequent value
cat_imputer = SimpleImputer(strategy='most_frequent')

df_cat = cat_imputer.fit_transform(df[categ_cols])
df_cat = pd.DataFrame(df_cat, columns=df[categ_cols].columns)

# Encode categoricals with One Hot Encoding
ohe = OneHotEncoder(sparse=False)

df_cat = pd.DataFrame(ohe.fit_transform(df_cat),
columns=ohe.get_feature_names_out())

# List of numerical columns
num_cols = [col for col in df.columns
if df[col].dtype in ['int64', 'float64']]

# Impute numericals
it_imp = IterativeImputer()

df_num = pd.DataFrame(it_imp.fit_transform(df[num_cols]),
columns=df[num_cols].columns)

# Concatenate with encoded categorical columns
df = pd.concat([df_cat, df_num], axis=1)

df["mother"] = " "
df.loc[(df["Age"] >= 32)& (df['Sex_female'] == 1) & (df['Parch'] > 1),"mother"] = "mother"
dummies_mother = pd.get_dummies(df['mother'], prefix= 'mother')
df = pd.concat([df,dummies_mother], axis=1)

# Create a full data frame for analysis
X = df[:X_max_index]
full_df = pd.concat([X, y], axis=1)

def survive_chance_by(feature, xticks=None, xlim=None):
survived = full_df[full_df.Survived == 1]
not_survived = full_df[full_df.Survived == 0]

plt.figure(figsize=(10, 5))

survived[feature].plot(kind='kde', label='survived')
not_survived[feature].plot(kind='kde', label='not_survived')

plt.xlim(xlim)
plt.xticks(xticks)
plt.legend()
plt.grid()
plt.xlabel(feature)
plt.show()

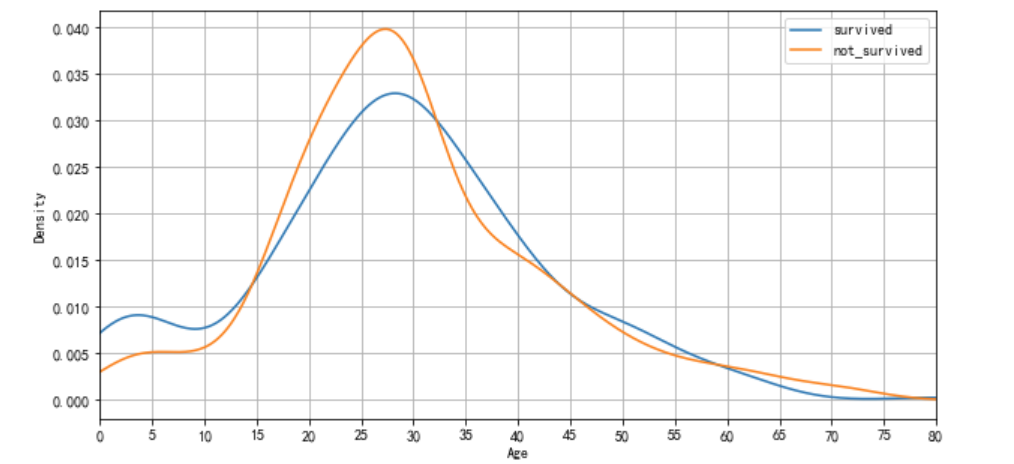
survive_chance_by('Age', np.arange(0, 81, 5), (0, 80))

df['Age_group'] = pd.cut(x=df.Age, bins=[0, 15, 32, 44, df.Age.max()],
labels=['Child', 'Young', 'Adult', 'Old'])

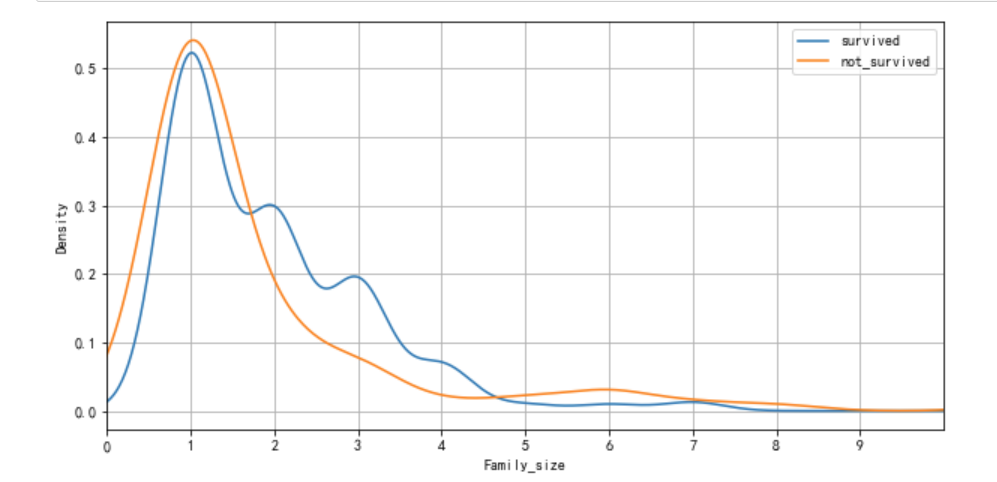
survive_chance_by('Family_size', np.arange(0, 10, 1), (0, 10))

# Survivers by Family_survivers
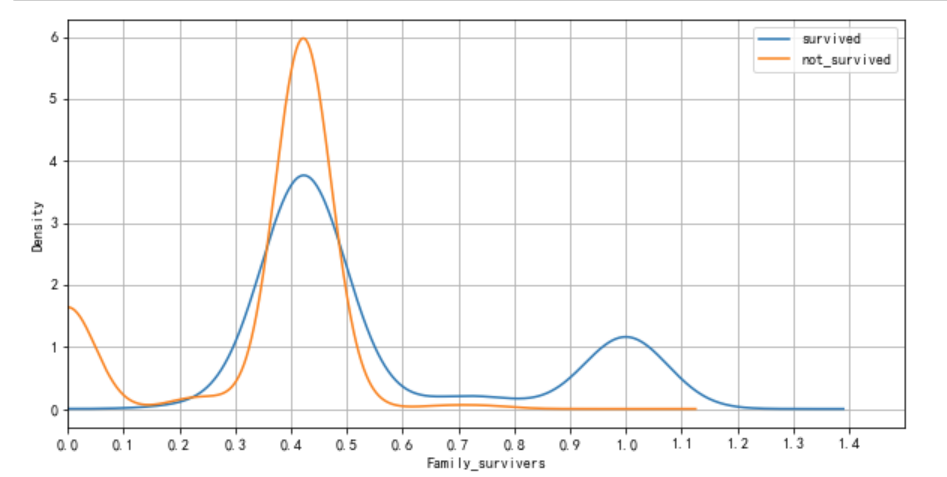
survive_chance_by('Family_survivers', np.arange(0, 1.5, 0.1), (0, 1.5))

df['Lucky_family'] = pd.cut(x=df.Family_survivers,
bins=[0, 0.22, 0.35, 0.49, df.Family_survivers.max()],
labels=['Low', 'Medium', 'Very_low', 'High'])
# Encode categoricals
df = pd.get_dummies(df)

# Apply np.log to normalize the skewed right Price
df.Price = df.Price.apply(np.log1p)

# Standardize
std_scaler = StandardScaler()

df_scaled = std_scaler.fit_transform(df)
df = pd.DataFrame(df_scaled, columns=df.columns)

# Drop features not used for modeling
cols_to_drop = ['Family_survivers', 'SibSp', 'Parch', 'Family_size']
df = df.drop(cols_to_drop, axis=1)

X = df[:X_max_index]
test_df = df[X_max_index:]

# Concatenate into a full dataset
full_df = pd.concat([X, y], axis=1)

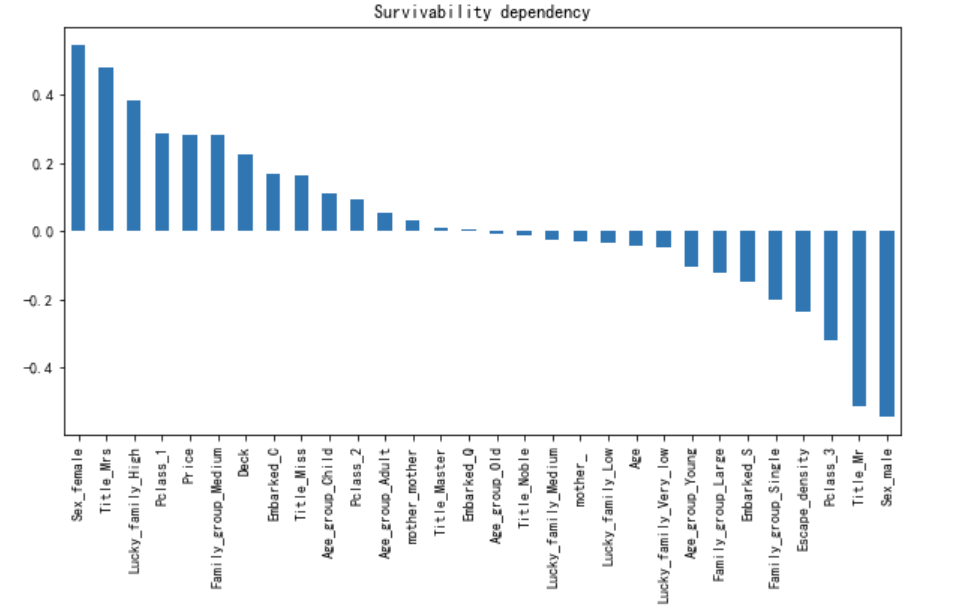
correlation = full_df.corr()['Survived'].sort_values(ascending=False)

# Correlation graph
correlation[1:].plot(kind='bar', figsize=(10,5), title='Survivability dependency')
plt.show()

年龄与获救关系

家庭成员数与获救关系

家庭存货指数与获救关系

corr

模型训练

1
2
3
4
5
6
7
8
9
10
11
12
13
14
15
16
17
18
19
20
21
22
23
24
25
26
27
28
29
30
31
32
33
34
35
36
37
38
39
40
41
42
43
44
45
46
47
48
49
50
51
52
53
54
55
56
57
58
59
60
61
62
63
64
65
66
67
68
69
70
71
72
73
74
75
76
77
78
79
80
81
82
from sklearn.ensemble import RandomForestRegressor

from sklearn import ensemble

# fit到RandomForestRegressor之中
clf = rfc = ensemble.RandomForestClassifier(n_estimators=31
,random_state=42
,max_depth=8
,min_samples_split=11
,max_features=7)
clf.fit(X, y)

clf.score(X,y)

from sklearn.model_selection import cross_val_score
scorel = []
for i in range(0,300,10):
rfc = ensemble.RandomForestClassifier(n_estimators=i+1,random_state=42)
score = cross_val_score(rfc, X, y, cv=10).mean()
scorel.append(score)
print(max(scorel),(scorel.index(max(scorel))*10)+1)
plt.figure(figsize=[20,5])
plt.plot(range(1,301,10),scorel)

from sklearn.model_selection import cross_val_score
scorel = []
for i in range(260,280,1):
rfc = ensemble.RandomForestClassifier(n_estimators=i+1,random_state=42)
score = cross_val_score(rfc, X, y, cv=10).mean()
scorel.append(score)
print(max(scorel),(scorel.index(max(scorel)))+1)
plt.figure(figsize=[20,5])
plt.plot(range(260,280,1),scorel)

#调整max_depth -
from sklearn.model_selection import GridSearchCV
param_grid = {'max_depth':np.arange(1, 20, 1)}
# 一般根据数据的大小来进行一个试探,乳腺癌数据很小,所以可以采用1~10,或者1~20这样的试探
# 但对于像digit recognition那样的大型数据来说,我们应该尝试30~50层深度(或许还不足够 应该画出学习曲线,来观察深度对模型的影响
rfc = ensemble.RandomForestClassifier(n_estimators=270
,random_state=42
)
GS = GridSearchCV(rfc,param_grid,cv=10)
GS.fit(X,y)
GS.best_score_

# 这边我们接着调了Min_samples_split 把模型往左边推移
param_grid = {'min_samples_split':np.arange(2, 2+20, 1)}
rfc = ensemble.RandomForestClassifier(n_estimators=270
,random_state=42
,max_depth=9
# ,min_samples_split=11
)
GS = GridSearchCV(rfc,param_grid,cv=10)
GS.fit(X,y)
GS.best_params_ # 显示调整出来的最佳参数

# 这边我们接着调了Min_samples_split 把模型往左边推移
param_grid = {'max_features':np.arange(3,30,1)}
rfc = ensemble.RandomForestClassifier(n_estimators=270
,random_state=42
,max_depth=9
,min_samples_split=17
# ,max_features=7
)
GS = GridSearchCV(rfc,param_grid,cv=10)
GS.fit(X,y)
GS.best_params_ # 显示调整出来的最佳参数
# 这个结果就是往左推会降低,因此要把模型往右边推

rfc = ensemble.RandomForestClassifier(n_estimators=270
,random_state=42
,max_depth=9
,min_samples_split=17
,max_features=16
)
rfc.fit(X,y)
rfc.score(X,y)

predictions = rfc.predict(test_df)
result = pd.DataFrame({'PassengerId':test_pass_id, 'Survived':predictions.astype(np.int32)})
result.head(10)